visualizations
analysis
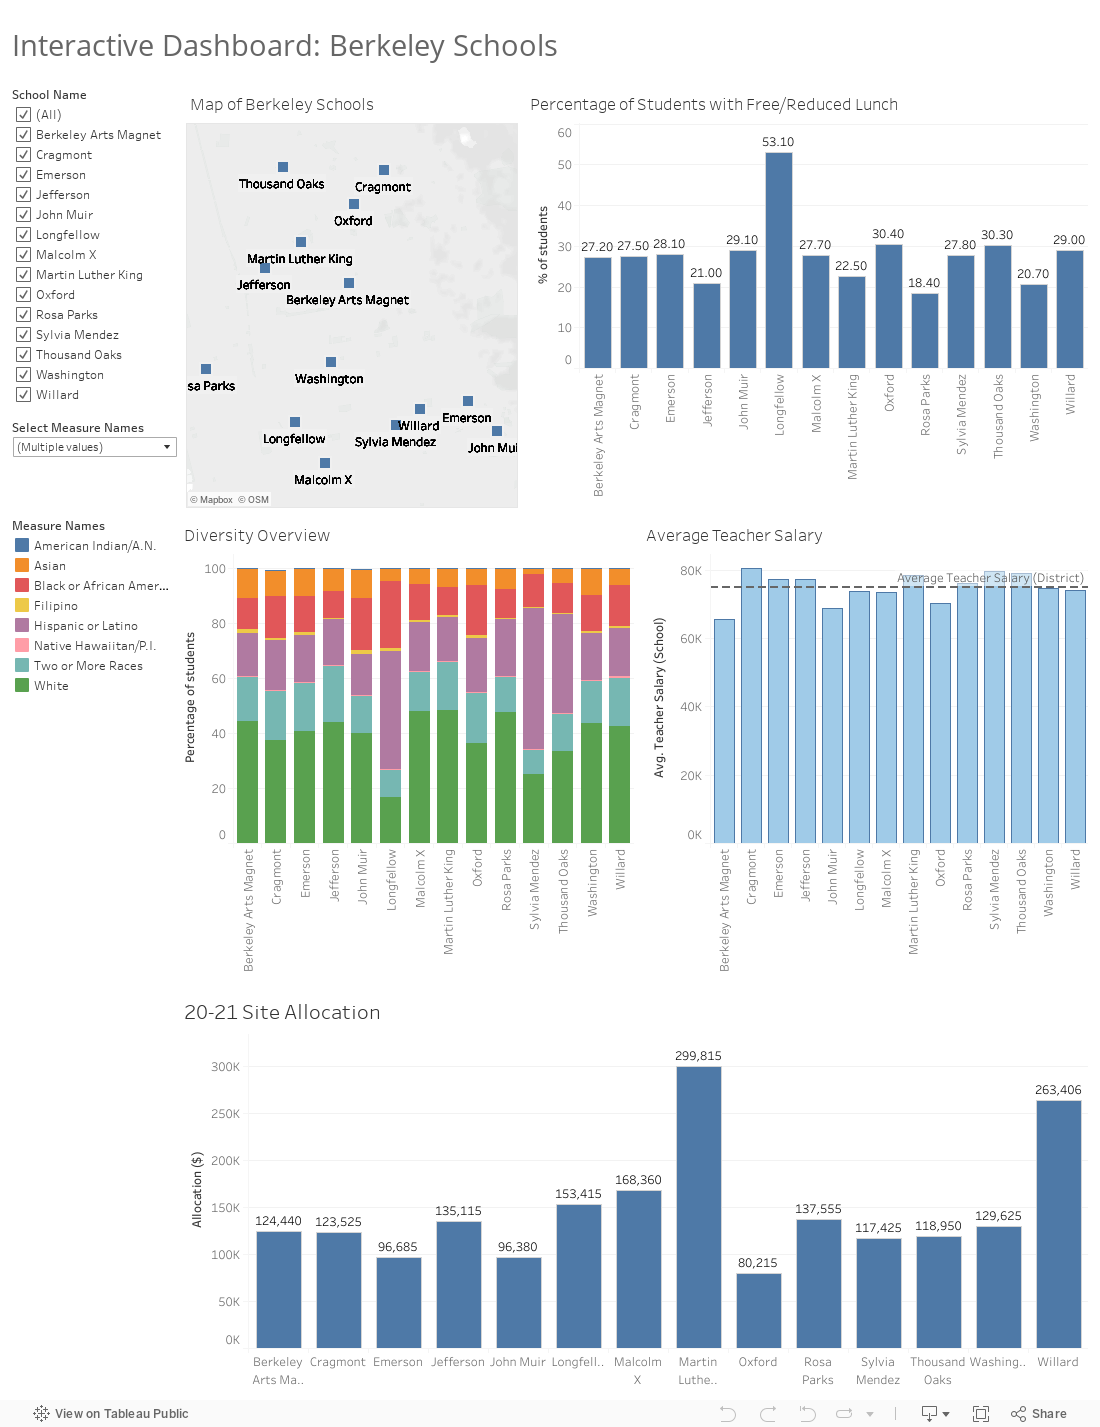
The Berkeley Unified School District:
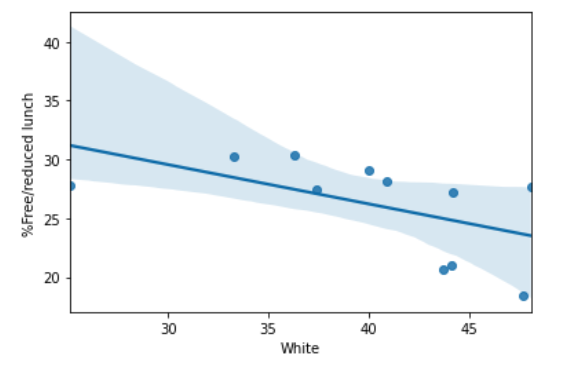
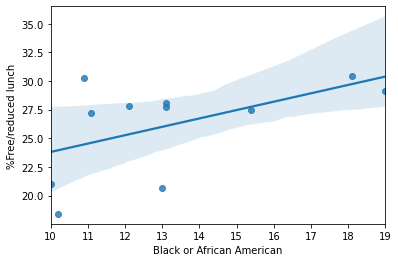
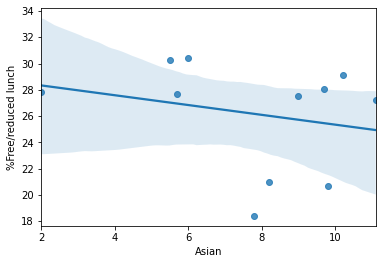
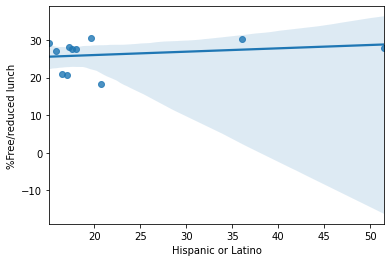
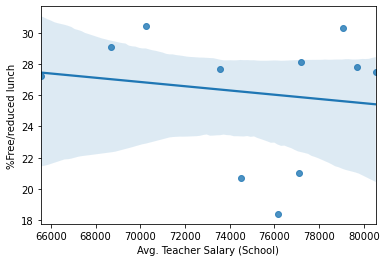
Percentage of Free / Reduced price Lunch Based on Race Percentages:
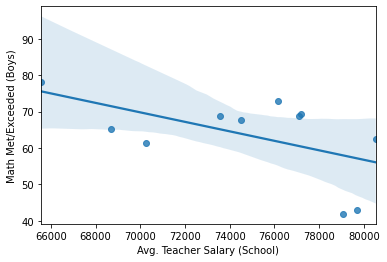
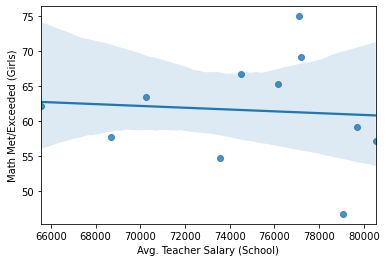
Does Teacher Salary Play a Role?
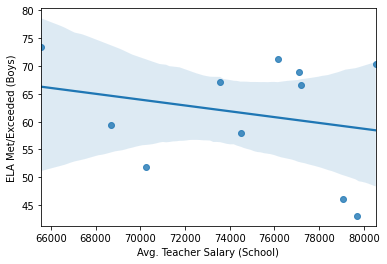
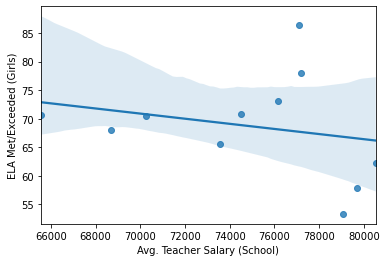
Consideration of race, reduced lunch, teacher salary, and its effect on ELA scores in elementary schools
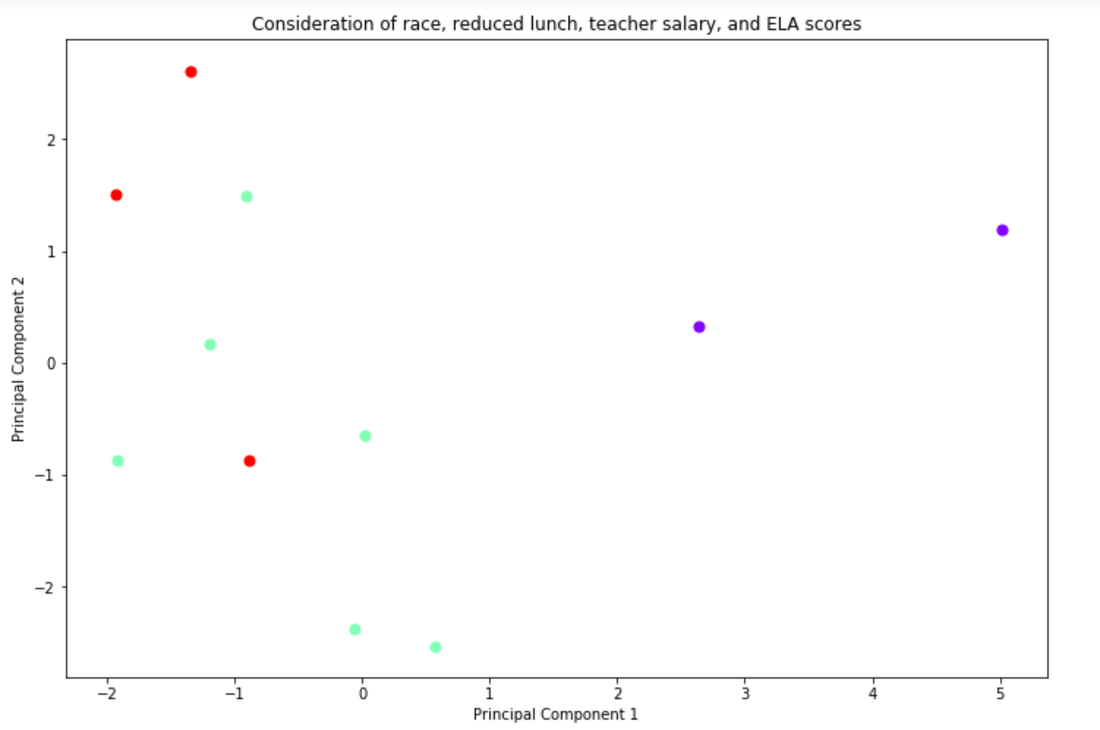
Key:
LOW : <50% of students met or exceeded standards
MED: 50-60%
HIGH: >60%
Categories considered: Average Teacher Salary, all race percentages, % Free/reduced lunch
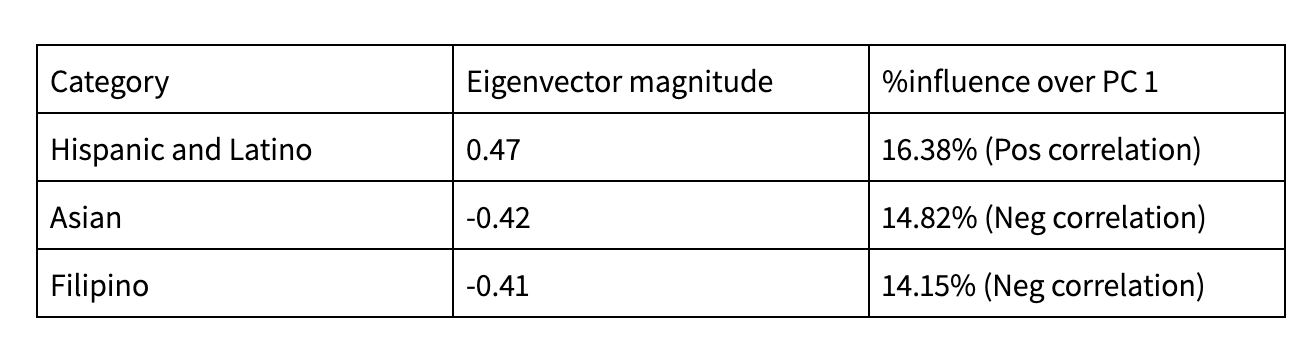
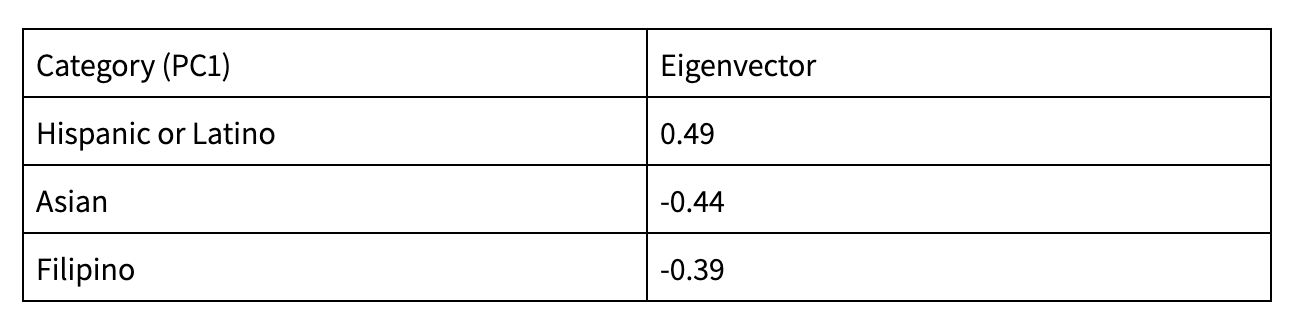
The PCs here cannot be mapped to a specific column like we could in the surfboard example. In this case, it is actually a combination of different columns. In this case, it looks like the features that contributed to the biggest variance in score were race based. The following categories contributed the most to PC1:
LOW : <50% of students met or exceeded standards
MED: 50-60%
HIGH: >60%
Categories considered: Average Teacher Salary, all race percentages, % Free/reduced lunch
The PCs here cannot be mapped to a specific column like we could in the surfboard example. In this case, it is actually a combination of different columns. In this case, it looks like the features that contributed to the biggest variance in score were race based. The following categories contributed the most to PC1:
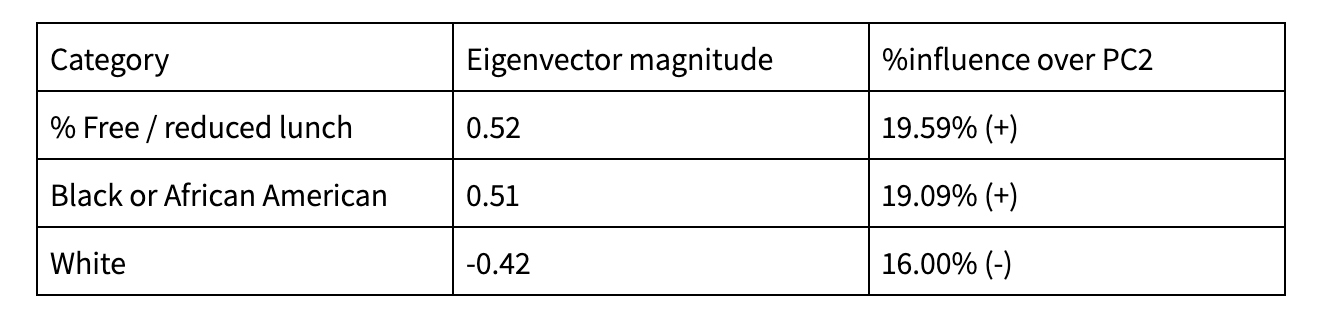
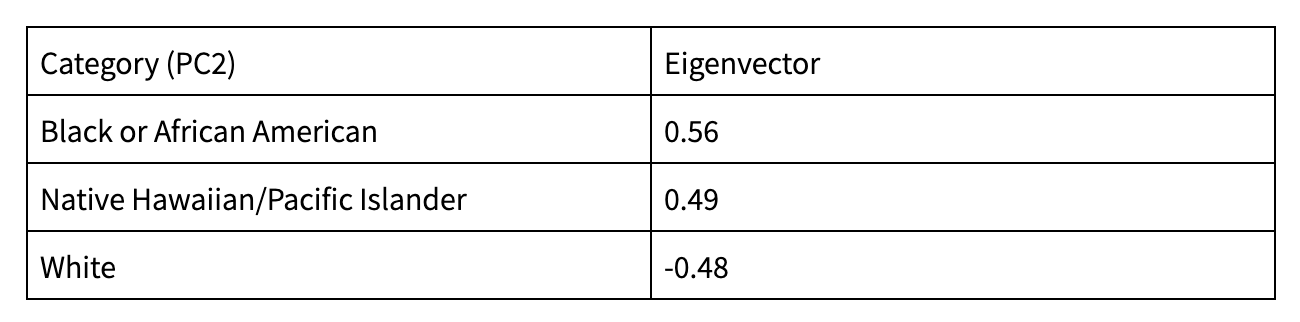
The following categories contributed the most to PC2:
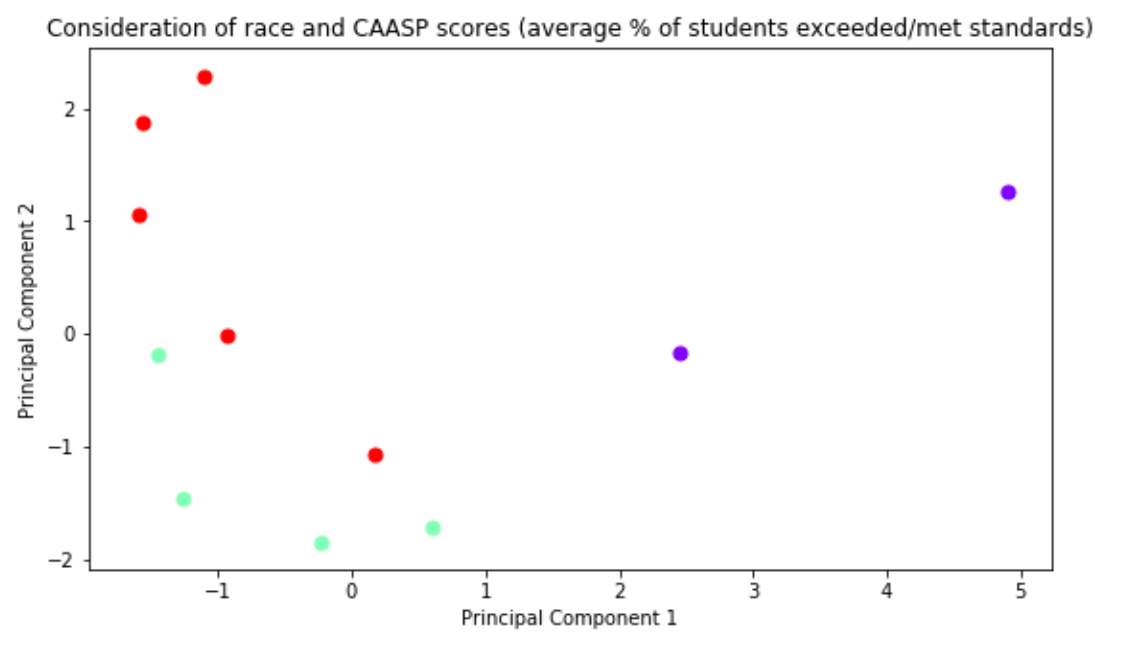
The data shown here is reflective of the scores you see when you compare how well each race does in the ELA portion of the CAASP exam.
We notice here that the schools that perform the lowest have a distinctly positive PC1 value, while those that have higher ELA passing percentages have lower PC1 scores. The groups that tend to perform well, Asians, Filipinos, and Whites, have negative correlations with their PCs, while groups that tend to perform less well have positive correlations.
We notice here that the schools that perform the lowest have a distinctly positive PC1 value, while those that have higher ELA passing percentages have lower PC1 scores. The groups that tend to perform well, Asians, Filipinos, and Whites, have negative correlations with their PCs, while groups that tend to perform less well have positive correlations.
Consideration of race % and CAASP scores
Key:
LOW : <60% of students met or exceeded standards
MED: 60-70%
HIGH: >70%
LOW : <60% of students met or exceeded standards
MED: 60-70%
HIGH: >70%
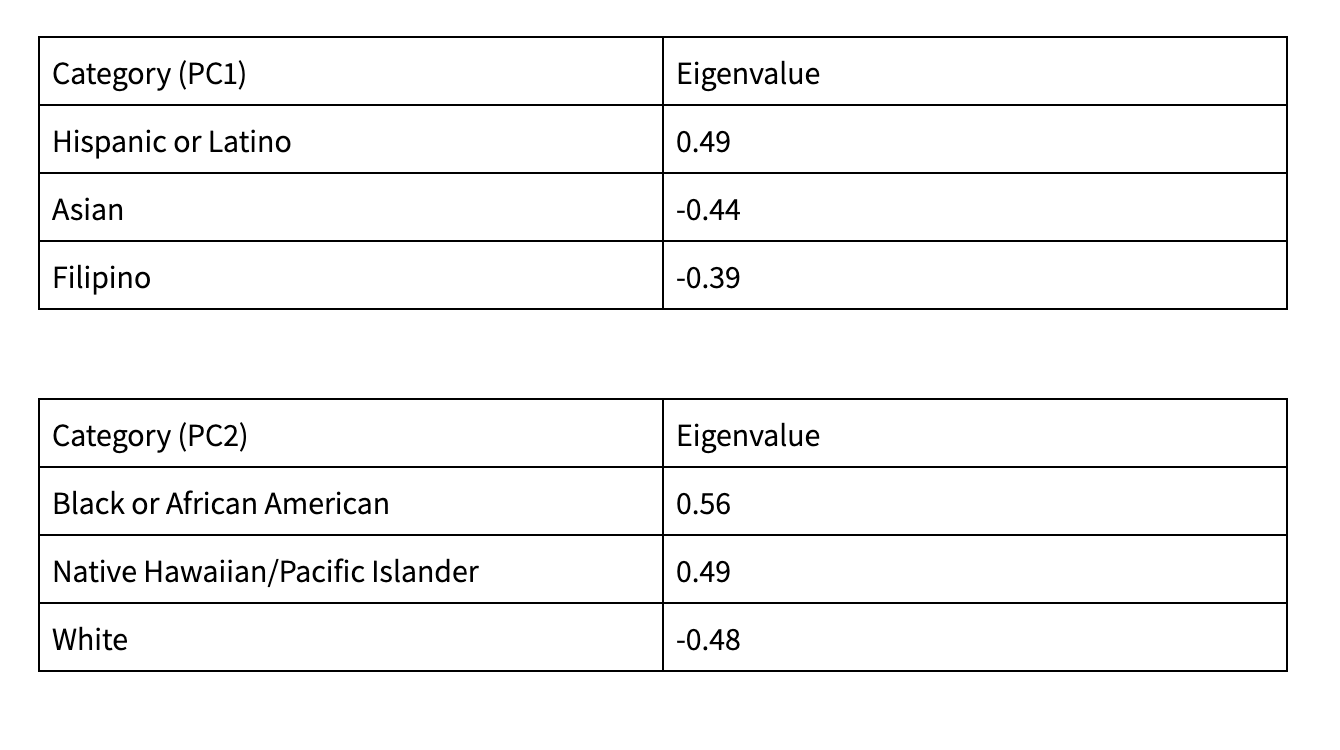
The analysis here, without consideration of reduced lunch or teacher salary, mimics results from the first chart. The data is extended to math CAASP scores as well, and we can see that the schools that tend to score higher have a higher population of White, Asian, and Filipino students.
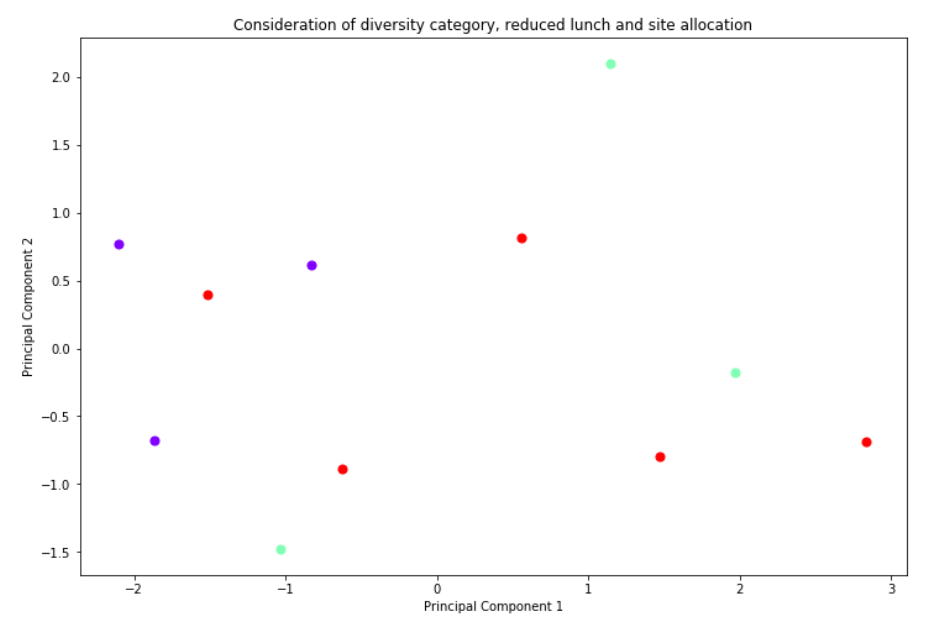
Consideration of diversity category and reduced lunch and its influence on site funding
Key:
LOW : <$100k in funding for the 2020-2021 school year
MED: $100k-130k
HIGH: >$130k
A note on diversity category: these were derived from the district’s interpretation of a number of factors, such as parent education, socioeconomic status, and race. We can see pretty clearly that the variance cannot really be well explained here, suggesting that there’s no distinct correlation between the variables and how much money the elementary school receives.
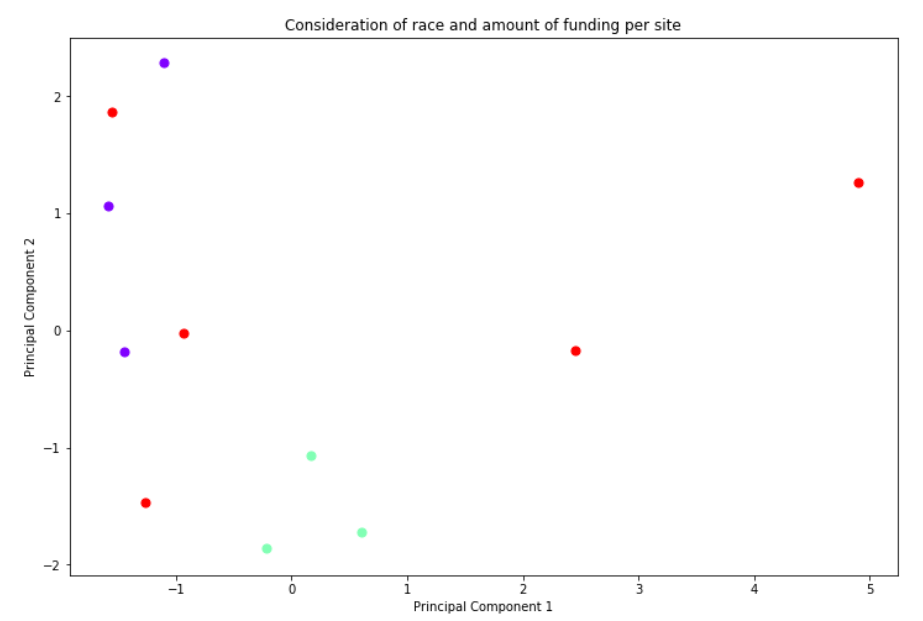
Consideration of race and its impact on amount of funding per site
Key:
LOW : <$100k in funding for the 2020-2021 school year (does not include staff salaries)
MED: $100k-130k
HIGH: >$130k
Not as clear of a division as the first two plots, but certainly neater than the last one! Schools with medium funding are distributed widely over the map, so it is difficult to comment on them. The only thing that can be said is that race does not seem to have much influence on these schools’ 2020-2021 funding.
Interestingly, PC1 seems to have no correlation with the most-funded sites, while the sites that receive the least funding appear to have larger numbers of Asian and Filipino students
The highest-funded schools seem to have a large White population, which is also interesting. It certainly raises the question of what factors actually influence site funding.
Neil Kamdar, Yolanda Shen, Saadhvi Umesh, Kaushal Partani
Berkeley Engineers and Mentors (BEAM) 2020-2021
